Microsoft Excel is a powerful spreadsheet software developed by Microsoft Corporation, initially released for the Apple Macintosh in 1985 and later for Microsoft Windows. Over the years, it has become an integral tool in various industries, businesses, and educational institutions. Its significance lies in its ability to organize, analyze, and visualize data efficiently, making it a cornerstone in data management and decision-making processes.
In this tutorial, I will teach you the importance of Excel and how master it.
Disclaimer: I am not responsible for any damage that may occur.
Importance of Microsoft Excel
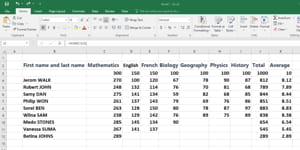
- Data Organization and Analysis: Excel provides a structured grid of cells where users can input, manipulate, and analyze data. Its versatile features, such as sorting, filtering, and conditional formatting, allow for efficient organization and analysis of vast datasets. This is crucial for tasks ranging from financial analysis to project management.
- Formula and Function Capabilities: Excel’s extensive library of built-in formulas and functions simplifies complex calculations. From basic arithmetic to advanced statistical and financial computations, users can leverage these tools to perform tasks accurately and efficiently. Formulas create dynamic relationships between cells, ensuring data consistency and reducing manual errors.
- Data Visualization with Charts and Graphs: Excel excels in transforming raw data into visually appealing charts and graphs. Users can choose from a variety of chart types to represent data trends, making it easier to interpret and communicate information. This feature is invaluable in presentations, reports, and decision-making processes.
- Automation and Macros: Excel allows users to automate repetitive tasks through macros. By recording a series of actions, users can create macros to execute complex processes with a single click. This automation enhances productivity and reduces the likelihood of errors in tasks that require consistent execution.
- Collaboration and Data Sharing: Excel’s compatibility with cloud services like Microsoft 365 and collaboration features enables multiple users to work on the same spreadsheet simultaneously. Real-time updates and version control enhance teamwork, making it a valuable tool for collaborative projects.
- Financial Modeling and Analysis: In finance, Excel is widely used for financial modeling, budgeting, and forecasting. Its ability to handle complex calculations and scenarios makes it indispensable for professionals in the finance sector. The use of functions like NPV, IRR, and financial modeling tools sets Excel apart in financial analysis.
Evolution of Microsoft Excel
- Early Versions (1985-1995): The initial versions of Excel focused on basic spreadsheet functionalities. The software’s user interface underwent refinements during this period, making it more user-friendly.
- Integration with Windows (1995-2000): With the integration of Excel into the Windows platform, the software gained popularity. New features, including enhanced charting options and increased row and column capacities, were introduced.
- Advanced Functionality (2000-2010): The 2000s saw significant advancements in Excel’s functionality. The introduction of the Ribbon interface in Excel 2007 streamlined access to commands, while Excel 2010 brought improved data analysis tools and enhanced collaboration features.
- Cloud Integration and Collaboration (2013-Present): In recent years, Excel has embraced cloud computing with the introduction of Microsoft 365. This transition allows users to collaborate in real-time, access spreadsheets from any device, and benefit from continuous updates and improvements.
Mastering Microsoft Excel
- Understand the Basics: Start with a solid understanding of Excel’s interface, including the Ribbon, cells, rows, columns, and sheets. Familiarize yourself with basic formatting options, data entry, and cell referencing.
- Learn Formulas and Functions: Master essential formulas (SUM, AVERAGE, IF) and functions (VLOOKUP, HLOOKUP, INDEX-MATCH). Understand how to use absolute and relative cell references to create dynamic formulas.
- Explore Data Analysis Tools: Dive into Excel’s data analysis tools, including sorting, filtering, and PivotTables. These features are essential for efficiently handling and interpreting large datasets.
- Create Visualizations: Experiment with Excel’s chart and graph options to visually represent data. Learn to choose the most appropriate chart type for different datasets and customize visuals to enhance clarity.
- Utilize Advanced Features: Explore advanced features like conditional formatting, data validation, and scenario manager. Understand how to protect sheets, use templates, and employ data tables for sophisticated analyses.
- Automation with Macros: Delve into the world of macros to automate repetitive tasks. Record and edit macros, and understand how to use Visual Basic for Applications (VBA) for more complex automation.
- Stay Updated: Excel evolves, and new features are regularly introduced. Stay informed about updates, explore new functionalities, and adapt your skills to leverage the latest tools offered by Microsoft.
Microsoft Excel’s journey from a basic spreadsheet tool to a sophisticated data management and analysis powerhouse underscores its enduring relevance. Its importance in organizing, analyzing, and visualizing data has made it a staple in diverse fields. Mastering Excel involves progressing from foundational knowledge to exploring its advanced features, empowering users to harness its full potential for data-driven decision-making. As Excel continues to evolve, so too will its impact on productivity, collaboration, and data management across various domains.
Share on: